ProductExecutive dashboard
Reliability, in numbers a board reads.
Attainment, error budget, incidents and time to recover across every SLO, computed the way your SLA reports are.
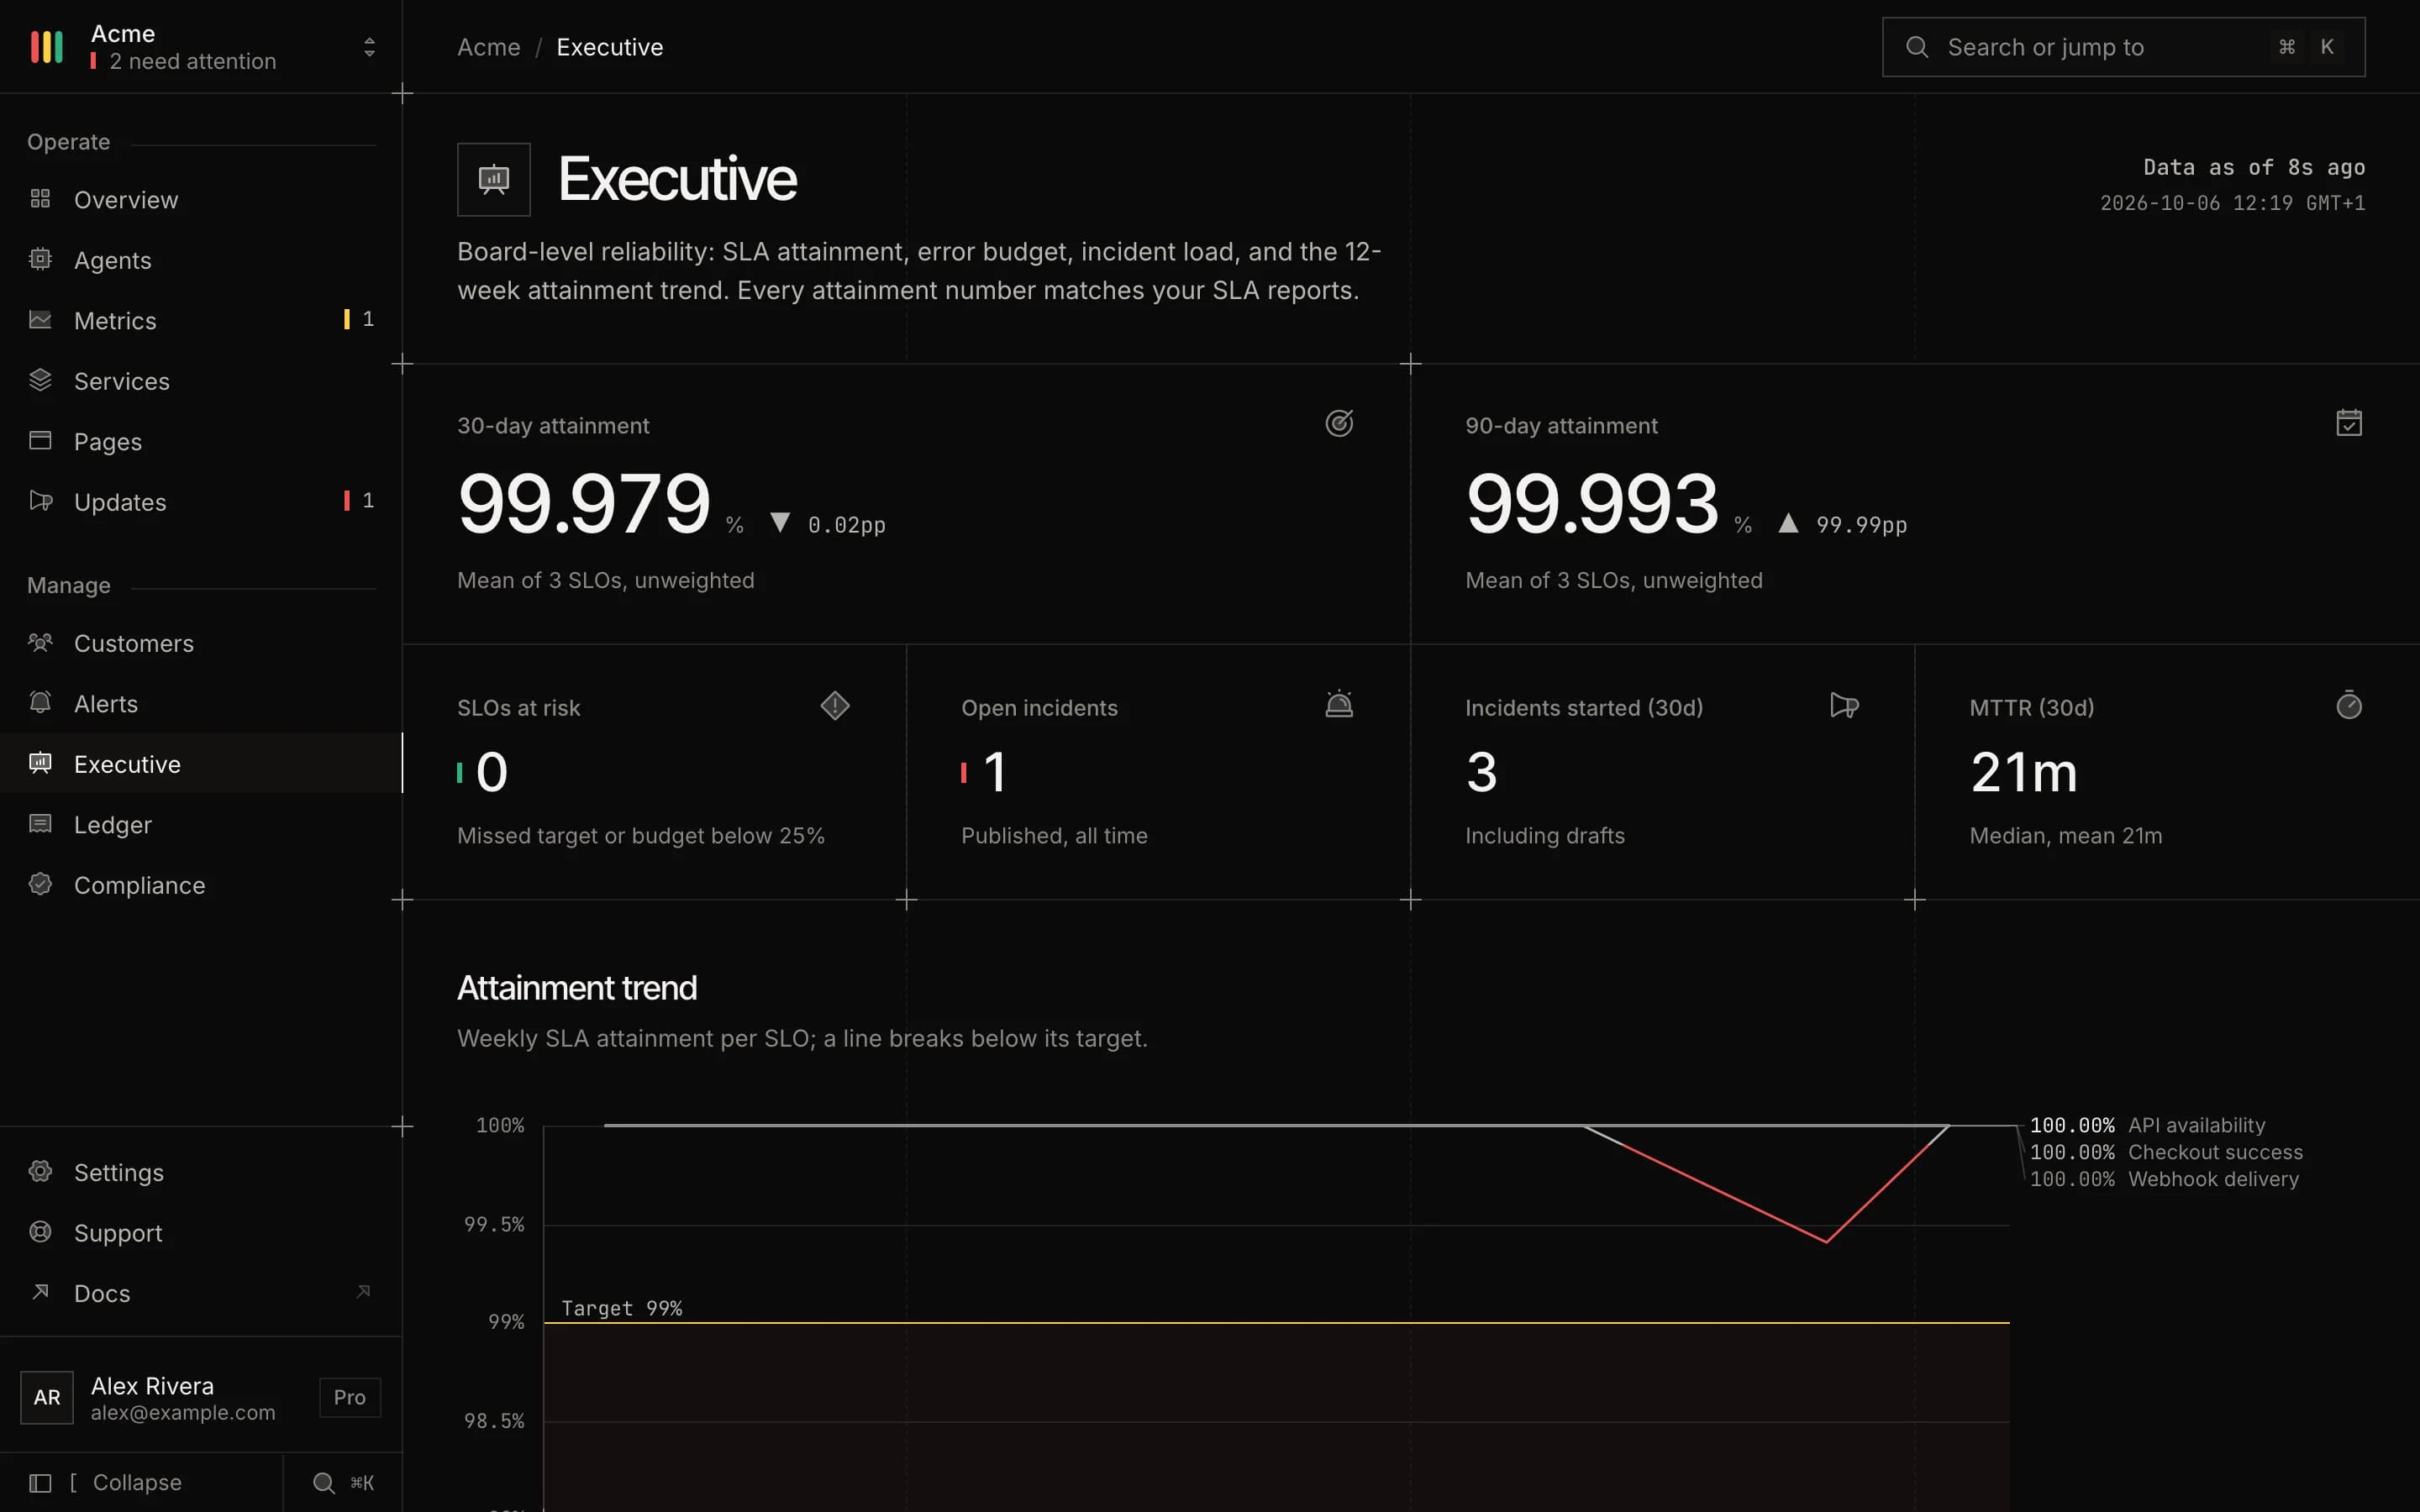
The dashboard
Where reliability is heading, not only where it is.
Twelve weeks of attainment, thirty days of error budget and six months of incidents, from the same checks your status page reads.
Attainment trend
Weekly SLA attainment per SLO; a line breaks below its target.
| Week | API availability (target 99.9%) | Checkout latency (target 99.5%) | Webhook delivery (target 99%) | Ingest availability (target 99.9%) | Dashboard availability (target 99.5%) |
|---|---|---|---|---|---|
| W30 | 99.97% | 99.84% | 99.64% | 99.99% | 99.94% |
| W31 | 99.96% | 99.78% | 99.55% | 99.95% | 99.94% |
| W32 | 99.97% | 99.41% | 99.75% | 99.98% | 99.96% |
| W33 | 99.96% | 99.84% | 99.47% | 99.97% | 99.90% |
| W34 | 99.96% | 99.73% | 99.75% | 99.97% | 99.99% |
| W35 | 99.98% | 99.80% | 99.56% | 99.97% | 99.89% |
| W36 | 99.94% | 99.79% | 99.59% | 99.98% | 99.98% |
| W37 | 99.87% | 99.76% | 99.72% | 99.96% | 99.92% |
| W38 | 99.94% | 99.78% | 99.49% | 99.98% | 99.94% |
| W39 | 99.98% | 99.82% | 99.73% | 99.96% | 99.95% |
| W40 | 99.96% | 99.70% | 99.56% | 99.93% | 99.93% |
| W41 | 99.96% | 99.89% | 99.63% | 99.98% | 99.94% |
Error budget trajectory
Budget remaining over each SLO's rolling window, hourly over the last 30 days, for the 5 riskiest SLOs.
| Hour (UTC) | API availability | Checkout latency | Webhook delivery | Ingest availability | Dashboard availability |
|---|---|---|---|---|---|
| 2026-09-28 16:00 | -1.8% | 26.3% | 63.3% | 85.1% | 92.7% |
| 2026-09-28 17:00 | -1.5% | 26.2% | 63.1% | 85.4% | 93.0% |
| 2026-09-28 18:00 | -1.6% | 26.5% | 63.4% | 85.2% | 92.9% |
| 2026-09-28 19:00 | -1.7% | 26.3% | 63.3% | 85.1% | 92.8% |
| 2026-09-28 20:00 | -1.4% | 26.3% | 63.3% | 85.4% | 93.2% |
| 2026-09-28 21:00 | -1.4% | 26.5% | 63.6% | 85.3% | 93.0% |
| 2026-09-28 22:00 | -1.4% | 26.3% | 63.4% | 85.3% | 93.0% |
| 2026-09-28 23:00 | -1.0% | 26.3% | 63.4% | 85.6% | 93.2% |
| 2026-09-29 00:00 | -1.0% | 26.4% | 63.6% | 85.4% | 92.9% |
| 2026-09-29 01:00 | -0.9% | 26.2% | 63.3% | 85.4% | 92.9% |
| 2026-09-29 02:00 | -0.5% | 26.0% | 63.2% | 85.6% | 93.0% |
| 2026-09-29 03:00 | -0.5% | 26.2% | 63.4% | 85.4% | 92.7% |
| 2026-09-29 04:00 | -0.5% | 25.8% | 63.1% | 85.3% | 92.7% |
| 2026-09-29 05:00 | -0.2% | 25.8% | 63.0% | 85.5% | 92.9% |
| 2026-09-29 06:00 | -0.3% | 25.9% | 63.2% | 85.2% | 92.6% |
| 2026-09-29 07:00 | -0.3% | 25.7% | 62.9% | 85.1% | 92.7% |
| 2026-09-29 08:00 | 0.0% | 25.7% | 63.0% | 85.3% | 93.0% |
| 2026-09-29 09:00 | -0.2% | 25.9% | 63.2% | 85.1% | 92.8% |
| 2026-09-29 10:00 | -0.1% | 25.7% | 63.0% | 85.2% | 92.9% |
| 2026-09-29 11:00 | 0.2% | 25.8% | 63.2% | 85.4% | 93.1% |
| 2026-09-29 12:00 | 0.0% | 26.0% | 63.4% | 85.2% | 92.9% |
| 2026-09-29 13:00 | 0.2% | 25.7% | 63.1% | 85.3% | 93.0% |
| 2026-09-29 14:00 | 0.5% | 25.8% | 63.2% | 85.5% | 93.1% |
| 2026-09-29 15:00 | 0.4% | 25.9% | 63.3% | 85.3% | 92.8% |
| 2026-09-29 16:00 | 0.7% | 25.5% | 63.0% | 85.4% | 92.9% |
| 2026-09-29 17:00 | 1.0% | 25.6% | 63.1% | 85.5% | 92.9% |
| 2026-09-29 18:00 | 0.9% | 25.6% | 63.1% | 85.2% | 92.6% |
| 2026-09-29 19:00 | 1.1% | 25.2% | 62.8% | 85.3% | 92.8% |
| 2026-09-29 20:00 | 1.3% | 25.3% | 62.9% | 85.3% | 92.8% |
| 2026-09-29 21:00 | 1.1% | 25.3% | 62.9% | 85.0% | 92.6% |
| 2026-09-29 22:00 | 1.3% | 25.0% | 62.7% | 85.2% | 92.8% |
| 2026-09-29 23:00 | 1.4% | 25.3% | 62.9% | 85.2% | 92.9% |
| 2026-09-30 00:00 | 1.2% | 25.3% | 63.0% | 84.9% | 92.7% |
| 2026-09-30 01:00 | 1.5% | 25.1% | 62.8% | 85.2% | 93.0% |
| 2026-09-30 02:00 | 1.6% | 25.3% | 63.1% | 85.2% | 93.0% |
| 2026-09-30 03:00 | 1.5% | 25.3% | 63.1% | 85.1% | 92.8% |
| 2026-09-30 04:00 | 1.8% | 25.1% | 62.9% | 85.4% | 93.1% |
| 2026-09-30 05:00 | 2.0% | 25.3% | 63.1% | 85.4% | 93.0% |
| 2026-09-30 06:00 | 1.9% | 25.2% | 63.0% | 85.2% | 92.8% |
| 2026-09-30 07:00 | 2.3% | 24.9% | 62.8% | 85.4% | 93.0% |
| 2026-09-30 08:00 | 2.4% | 25.1% | 63.0% | 85.4% | 92.8% |
| 2026-09-30 09:00 | 2.4% | 24.9% | 62.8% | 85.1% | 92.6% |
| 2026-09-30 10:00 | 2.7% | 24.7% | 62.6% | 85.3% | 92.8% |
| 2026-09-30 11:00 | 2.7% | 24.8% | 62.8% | 85.2% | 92.7% |
| 2026-09-30 12:00 | 2.6% | 24.7% | 62.6% | 84.9% | 92.6% |
| 2026-09-30 13:00 | 2.9% | 24.5% | 62.5% | 85.2% | 92.9% |
| 2026-09-30 14:00 | 2.8% | 24.8% | 62.8% | 85.0% | 92.7% |
| 2026-09-30 15:00 | 2.7% | 24.6% | 62.6% | 84.9% | 92.7% |
| 2026-09-30 16:00 | 3.1% | 24.6% | 62.6% | 85.2% | 93.0% |
| 2026-09-30 17:00 | 3.0% | 24.8% | 62.9% | 85.1% | 92.9% |
| 2026-09-30 18:00 | 3.0% | 24.7% | 62.8% | 85.1% | 92.9% |
| 2026-09-30 19:00 | 3.4% | 24.6% | 62.7% | 85.4% | 93.1% |
| 2026-09-30 20:00 | 3.4% | 24.8% | 62.9% | 85.2% | 92.9% |
| 2026-09-30 21:00 | 3.5% | 24.5% | 62.7% | 85.2% | 92.8% |
| 2026-09-30 22:00 | 3.9% | 24.4% | 62.6% | 85.4% | 93.0% |
| 2026-09-30 23:00 | 3.8% | 24.6% | 62.8% | 85.2% | 92.7% |
| 2026-10-01 00:00 | 3.9% | 24.2% | 62.4% | 85.1% | 92.6% |
| 2026-10-01 01:00 | 4.3% | 24.2% | 62.4% | 85.3% | 92.8% |
| 2026-10-01 02:00 | 4.1% | 24.3% | 62.6% | 85.0% | 92.5% |
| 2026-10-01 03:00 | 4.2% | 24.0% | 62.3% | 84.9% | 92.6% |
| 2026-10-01 04:00 | 4.4% | 24.0% | 62.4% | 85.1% | 92.8% |
| 2026-10-01 05:00 | 4.2% | 24.2% | 62.6% | 84.8% | 92.6% |
| 2026-10-01 06:00 | 4.3% | 24.0% | 62.3% | 84.9% | 92.8% |
| 2026-10-01 07:00 | 4.6% | 24.1% | 62.5% | 85.1% | 93.0% |
| 2026-10-01 08:00 | 4.4% | 24.3% | 62.7% | 84.9% | 92.8% |
| 2026-10-01 09:00 | 4.6% | 24.0% | 62.5% | 85.1% | 92.9% |
| 2026-10-01 10:00 | 4.9% | 24.1% | 62.6% | 85.3% | 93.0% |
| 2026-10-01 11:00 | 4.8% | 24.2% | 62.7% | 85.1% | 92.7% |
| 2026-10-01 12:00 | 5.1% | 23.9% | 62.4% | 85.2% | 92.9% |
| 2026-10-01 13:00 | 5.4% | 24.0% | 62.5% | 85.3% | 92.9% |
| 2026-10-01 14:00 | 5.3% | 23.9% | 62.5% | 85.0% | 92.6% |
| 2026-10-01 15:00 | 5.5% | 23.6% | 62.2% | 85.1% | 92.7% |
| 2026-10-01 16:00 | 5.7% | 23.7% | 62.3% | 85.1% | 92.7% |
| 2026-10-01 17:00 | 5.5% | 23.7% | 62.3% | 84.8% | 92.5% |
| 2026-10-01 18:00 | 5.7% | 23.4% | 62.0% | 85.0% | 92.7% |
| 2026-10-01 19:00 | 5.9% | 23.6% | 62.2% | 85.0% | 92.8% |
| 2026-10-01 20:00 | 5.7% | 23.6% | 62.3% | 84.7% | 92.6% |
| 2026-10-01 21:00 | 5.9% | 23.4% | 62.1% | 84.9% | 92.9% |
| 2026-10-01 22:00 | 6.0% | 23.7% | 62.4% | 85.0% | 92.9% |
| 2026-10-01 23:00 | 5.9% | 23.7% | 62.4% | 84.8% | 92.7% |
| 2026-10-02 00:00 | 6.2% | 23.4% | 62.2% | 85.1% | 93.0% |
| 2026-10-02 01:00 | 6.4% | 23.7% | 62.5% | 85.1% | 92.9% |
| 2026-10-02 02:00 | 6.3% | 23.6% | 62.4% | 85.0% | 92.7% |
| 2026-10-02 03:00 | 6.7% | 23.3% | 62.2% | 85.2% | 92.9% |
| 2026-10-02 04:00 | 6.8% | 23.5% | 62.3% | 85.2% | 92.7% |
| 2026-10-02 05:00 | 6.7% | 23.3% | 62.2% | 84.9% | 92.5% |
| 2026-10-02 06:00 | 7.1% | 23.0% | 61.9% | 85.1% | 92.7% |
| 2026-10-02 07:00 | 7.1% | 23.2% | 62.1% | 85.0% | 92.6% |
| 2026-10-02 08:00 | 7.0% | 23.0% | 62.0% | 84.7% | 92.5% |
| 2026-10-02 09:00 | 7.3% | 22.9% | 61.8% | 85.0% | 92.7% |
| 2026-10-02 10:00 | 7.3% | 23.1% | 62.1% | 84.8% | 92.6% |
| 2026-10-02 11:00 | 7.2% | 23.0% | 62.0% | 84.7% | 92.6% |
| 2026-10-02 12:00 | 7.5% | 22.9% | 61.9% | 85.0% | 92.9% |
| 2026-10-02 13:00 | 7.4% | 23.2% | 62.2% | 84.8% | 92.8% |
| 2026-10-02 14:00 | 7.4% | 23.0% | 62.1% | 84.8% | 92.8% |
| 2026-10-02 15:00 | 7.8% | 22.9% | 62.1% | 85.1% | 93.0% |
| 2026-10-02 16:00 | 7.8% | 23.2% | 62.3% | 85.0% | 92.8% |
| 2026-10-02 17:00 | 7.8% | 22.9% | 62.1% | 85.0% | 92.7% |
| 2026-10-02 18:00 | 8.3% | 22.8% | 62.0% | 85.2% | 92.9% |
| 2026-10-02 19:00 | 8.2% | 22.9% | 62.1% | 85.0% | 92.6% |
| 2026-10-02 20:00 | 8.3% | 22.6% | 61.8% | 84.9% | 92.6% |
| 2026-10-02 21:00 | 8.7% | 22.5% | 61.8% | 85.1% | 92.7% |
| 2026-10-02 22:00 | 8.5% | 22.7% | 61.9% | 84.8% | 92.5% |
| 2026-10-02 23:00 | 8.6% | 22.4% | 61.7% | 84.7% | 92.5% |
| 2026-10-03 00:00 | 8.9% | 22.4% | 61.7% | 84.9% | 92.7% |
| 2026-10-03 01:00 | 8.7% | 22.6% | 61.9% | 84.6% | 92.5% |
| 2026-10-03 02:00 | 8.7% | 22.3% | 61.7% | 84.7% | 92.7% |
| 2026-10-03 03:00 | 9.0% | 22.4% | 61.8% | 84.9% | 92.9% |
| 2026-10-03 04:00 | 8.8% | 22.6% | 62.0% | 84.7% | 92.7% |
| 2026-10-03 05:00 | 9.0% | 22.4% | 61.8% | 84.8% | 92.8% |
| 2026-10-03 06:00 | 9.3% | 22.5% | 61.9% | 85.0% | 93.0% |
| 2026-10-03 07:00 | 9.2% | 22.6% | 62.1% | 84.8% | 92.7% |
| 2026-10-03 08:00 | 9.4% | 22.3% | 61.8% | 85.0% | 92.8% |
| 2026-10-03 09:00 | 9.8% | 22.3% | 61.9% | 85.1% | 92.8% |
| 2026-10-03 10:00 | 9.6% | 22.3% | 61.9% | 84.8% | 92.5% |
| 2026-10-03 11:00 | 9.9% | 22.0% | 61.5% | 84.9% | 92.6% |
| 2026-10-03 12:00 | 10.1% | 22.1% | 61.7% | 85.0% | 92.6% |
| 2026-10-03 13:00 | 10.0% | 22.0% | 61.7% | 84.6% | 92.4% |
| 2026-10-03 14:00 | 10.2% | 21.7% | 61.4% | 84.8% | 92.6% |
| 2026-10-03 15:00 | 10.3% | 21.9% | 61.6% | 84.8% | 92.6% |
| 2026-10-03 16:00 | 10.1% | 21.9% | 61.6% | 84.5% | 92.5% |
| 2026-10-03 17:00 | 10.3% | 21.7% | 61.4% | 84.7% | 92.8% |
| 2026-10-03 18:00 | 10.4% | 22.0% | 61.7% | 84.8% | 92.8% |
| 2026-10-03 19:00 | 10.3% | 22.0% | 61.7% | 84.6% | 92.6% |
| 2026-10-03 20:00 | 10.6% | 21.8% | 61.6% | 84.9% | 92.9% |
| 2026-10-03 21:00 | 10.7% | 22.0% | 61.8% | 84.9% | 92.8% |
| 2026-10-03 22:00 | 10.7% | 21.9% | 61.8% | 84.7% | 92.6% |
| 2026-10-03 23:00 | 11.0% | 21.7% | 61.5% | 85.0% | 92.8% |
| 2026-10-04 00:00 | 11.2% | 21.9% | 61.7% | 84.9% | 92.7% |
| 2026-10-04 01:00 | 11.1% | 21.7% | 61.6% | 84.7% | 92.5% |
| 2026-10-04 02:00 | 11.5% | 21.4% | 61.3% | 84.9% | 92.7% |
| 2026-10-04 03:00 | 11.5% | 21.6% | 61.5% | 84.8% | 92.5% |
| 2026-10-04 04:00 | 11.4% | 21.4% | 61.3% | 84.6% | 92.4% |
| 2026-10-04 05:00 | 11.8% | 21.2% | 61.2% | 84.8% | 92.6% |
| 2026-10-04 06:00 | 11.7% | 21.4% | 61.4% | 84.6% | 92.5% |
| 2026-10-04 07:00 | 11.6% | 21.3% | 61.3% | 84.4% | 92.5% |
| 2026-10-04 08:00 | 11.9% | 21.2% | 61.3% | 84.7% | 92.8% |
| 2026-10-04 09:00 | 11.8% | 21.5% | 61.6% | 84.6% | 92.7% |
| 2026-10-04 10:00 | 11.8% | 21.3% | 61.4% | 84.5% | 92.7% |
| 2026-10-04 11:00 | 12.2% | 21.3% | 61.4% | 84.9% | 92.9% |
| 2026-10-04 12:00 | 12.1% | 21.5% | 61.7% | 84.7% | 92.7% |
| 2026-10-04 13:00 | 12.2% | 21.3% | 61.4% | 84.7% | 92.7% |
| 2026-10-04 14:00 | 12.6% | 21.2% | 61.4% | 85.0% | 92.8% |
| 2026-10-04 15:00 | 12.6% | 21.3% | 61.5% | 84.8% | 92.5% |
| 2026-10-04 16:00 | 12.7% | 21.0% | 61.2% | 84.7% | 92.5% |
| 2026-10-04 17:00 | 13.1% | 20.9% | 61.2% | 84.9% | 92.7% |
| 2026-10-04 18:00 | 12.9% | 21.0% | 61.3% | 84.6% | 92.4% |
| 2026-10-04 19:00 | 13.0% | 20.7% | 61.0% | 84.5% | 92.4% |
| 2026-10-04 20:00 | 13.3% | 20.7% | 61.1% | 84.7% | 92.6% |
| 2026-10-04 21:00 | 13.1% | 20.9% | 61.2% | 84.4% | 92.4% |
| 2026-10-04 22:00 | 13.1% | 20.6% | 61.0% | 84.5% | 92.5% |
| 2026-10-04 23:00 | 13.4% | 20.7% | 61.1% | 84.7% | 92.8% |
| 2026-10-05 00:00 | 13.2% | 20.9% | 61.3% | 84.4% | 92.6% |
| 2026-10-05 01:00 | 13.4% | 20.7% | 61.1% | 84.6% | 92.7% |
| 2026-10-05 02:00 | 13.7% | 20.8% | 61.3% | 84.8% | 92.9% |
| 2026-10-05 03:00 | 13.6% | 20.9% | 61.4% | 84.6% | 92.6% |
| 2026-10-05 04:00 | 13.8% | 20.6% | 61.1% | 84.7% | 92.7% |
| 2026-10-05 05:00 | 14.1% | 20.7% | 61.2% | 84.9% | 92.8% |
| 2026-10-05 06:00 | 14.0% | 20.7% | 61.3% | 84.6% | 92.4% |
| 2026-10-05 07:00 | 14.3% | 20.4% | 60.9% | 84.7% | 92.6% |
| 2026-10-05 08:00 | 14.5% | 20.4% | 61.0% | 84.8% | 92.6% |
| 2026-10-05 09:00 | 14.4% | 20.4% | 61.0% | 84.4% | 92.3% |
| 2026-10-05 10:00 | 14.6% | 20.1% | 60.7% | 84.6% | 92.5% |
| 2026-10-05 11:00 | 14.7% | 20.3% | 60.9% | 84.6% | 92.5% |
| 2026-10-05 12:00 | 14.5% | 20.3% | 61.0% | 84.3% | 92.3% |
| 2026-10-05 13:00 | 14.7% | 20.0% | 60.8% | 84.5% | 92.6% |
| 2026-10-05 14:00 | 14.8% | 20.3% | 61.0% | 84.5% | 92.7% |
| 2026-10-05 15:00 | 14.7% | 20.3% | 61.1% | 84.3% | 92.5% |
| 2026-10-05 16:00 | 15.0% | 20.1% | 60.9% | 84.6% | 92.8% |
| 2026-10-05 17:00 | 15.1% | 20.4% | 61.2% | 84.6% | 92.8% |
| 2026-10-05 18:00 | 15.0% | 20.3% | 61.1% | 84.5% | 92.6% |
| 2026-10-05 19:00 | 15.4% | 20.0% | 60.9% | 84.8% | 92.8% |
| 2026-10-05 20:00 | 15.6% | 20.2% | 61.1% | 84.7% | 92.6% |
| 2026-10-05 21:00 | 15.5% | 20.0% | 61.0% | 84.5% | 92.4% |
| 2026-10-05 22:00 | 15.9% | 19.8% | 60.7% | 84.7% | 92.6% |
| 2026-10-05 23:00 | 16.0% | 20.0% | 60.9% | 84.6% | 92.4% |
| 2026-10-06 00:00 | 15.9% | 19.7% | 60.7% | 84.4% | 92.3% |
| 2026-10-06 01:00 | 16.2% | 19.6% | 60.5% | 84.6% | 92.5% |
| 2026-10-06 02:00 | 16.1% | 19.8% | 60.8% | 84.4% | 92.4% |
| 2026-10-06 03:00 | 16.0% | 19.6% | 60.6% | 84.2% | 92.4% |
| 2026-10-06 04:00 | 16.3% | 19.5% | 60.6% | 84.5% | 92.7% |
| 2026-10-06 05:00 | 16.2% | 19.8% | 60.9% | 84.3% | 92.5% |
| 2026-10-06 06:00 | 16.2% | 19.6% | 60.8% | 84.3% | 92.5% |
| 2026-10-06 07:00 | 16.5% | 19.6% | 60.7% | 84.6% | 92.8% |
| 2026-10-06 08:00 | 16.5% | 19.8% | 61.0% | 84.5% | 92.6% |
| 2026-10-06 09:00 | 16.6% | 19.6% | 60.8% | 84.5% | 92.6% |
| 2026-10-06 10:00 | 17.0% | 19.5% | 60.7% | 84.8% | 92.8% |
| 2026-10-06 11:00 | 17.0% | 19.7% | 60.9% | 84.5% | 92.5% |
| 2026-10-06 12:00 | 17.1% | 19.4% | 60.6% | 84.5% | 92.4% |
| 2026-10-06 13:00 | 17.4% | 19.3% | 60.6% | 84.7% | 92.6% |
| 2026-10-06 14:00 | 17.3% | 19.4% | 60.7% | 84.4% | 92.3% |
| 2026-10-06 15:00 | 17.4% | 19.1% | 60.4% | 84.4% | 92.3% |
| 2026-10-06 16:00 | 17.7% | 19.1% | 60.4% | 84.5% | 92.5% |
| 2026-10-06 17:00 | 17.5% | 19.2% | 60.6% | 84.2% | 92.3% |
| 2026-10-06 18:00 | 17.6% | 19.0% | 60.3% | 84.2% | 92.4% |
| 2026-10-06 19:00 | 17.8% | 19.1% | 60.5% | 84.4% | 92.6% |
| 2026-10-06 20:00 | 17.6% | 19.2% | 60.7% | 84.2% | 92.4% |
| 2026-10-06 21:00 | 17.8% | 19.0% | 60.5% | 84.3% | 92.6% |
| 2026-10-06 22:00 | 18.1% | 19.1% | 60.6% | 84.5% | 92.8% |
| 2026-10-06 23:00 | 17.9% | 19.3% | 60.8% | 84.3% | 92.5% |
Incidents by month
By severity (including unpublished), last 6 months, with mean MTTR over the resolved ones.
| Month | Minor | Major | Critical | MTTR |
|---|---|---|---|---|
| May | 3 | 1 | 0 | 1h |
| Jun | 5 | 2 | 1 | 2h |
| Jul | 2 | 1 | 0 | 52m |
| Aug | 4 | 0 | 0 | 31m |
| Sep | 2 | 2 | 0 | 1h |
| Oct | 1 | 0 | 0 | – |
Headline
Five numbers at the top.
Attainment over 30 and 90 days, SLOs at risk, open incidents and median MTTR. Attainment and MTTR show the change since the window before.
At risk
Flagged before the miss.
An SLO counts as at risk when it missed its target or has less than 25% of its error budget left, so a slow week shows up before a breach does.
Every SLO
Target, attainment and budget, side by side.
Below the charts, every SLO with its target, its attainment and the budget left, plus the ten services with the most incidents in the last 30 days.
Growth
The reach of your pages.
Status page views, active subscribers and customers, week by week over 90 days.
The math
Numbers that hold up in an audit.
Attainment
The SLA report's own function.
Every attainment figure comes from the function behind your SLA reports. Degraded counts as up and maintenance is left out.
MTTR
Median, with the mean beside it.
One three-day outage cannot hide what a typical incident cost.
Drafts
Unpublished incidents count.
It is an internal report, so incidents you never published still count toward load and MTTR.
Freshness
Stamped with its age.
Numbers are assembled at most every ten minutes, and the page says when. With no window before to compare, the change is left blank.
Board report
The same numbers, on the 1st.
The dashboard and the board report are on Pro and up.
Monthly email
No deck to build.
On the first of each month, the 30-day numbers go to your organisation's members. Support switches it on for you.
What it carries
- 30-day attainmentacross every SLO
- Riskiest SLOstop 10, least budget first
- Incidentscount and MTTR
- Dashboardone link back