- Investigating22:25
p95 latency on the public API is above 500 ms. Requests are completing, more slowly than usual.
- Identified22:51
A slow query on the usage endpoint is holding connections. The fix is rolling out now.
ProductStatus pages
A status page your customers can trust.
It changes when your metrics do, shows each customer their own commitments, and lives on your domain. Nobody has to remember to update it.
Current status
At a glance
Uptime, 90 days
97.8%Services operational
3of 4Active incidents
1API latency under 500 ms
API
30 days
API availability
API
30 days
Webhook delivery
Webhooks
7 days
Dashboard availability
Dashboard
30 days
- API98.9%
- Dashboard100%
- Webhooks100%
- Database98.9%
- Investigating17:03
Webhook deliveries are running up to ten minutes late.
- Monitoring17:33
Workers are back to full capacity. Watching the queue drain.
- Resolved18:03
The queue has drained and every delayed event was delivered.
Verdicts
A status page that can't lie.
Each metric is judged by two thresholds with strict operators. The page follows the verdict, not someone's memory of updating it.
01The reading
API · Request latency p95
642ms
02The rule
- Healthy
- under 500
- Unhealthy
- over 1000
- Otherwise
- degraded
Degraded
Neither rule matches: between the two thresholds is degraded.
One bad sample does not flip the page. By default a worse verdict has to hold for 3 minutes before the page follows, a better one for 5. Both are set per metric.
03The page
API2 metrics Degraded
Incidents
An incident can raise the headline, never lower it.
A minor incident reads degraded even while every metric is healthy, and a real outage stays an outage whatever was posted.
Customers
Each customer sees their own status.
Sign customers in through your app. The same page shows each one the targets in their contract and the incidents scoped to them, and nothing scoped to anyone else.
Your dedicated export worker is behind. Exports finish, up to 15 minutes late.
- 54.2% of budget leftAPIAPI availability99.95% target, 30-day window (custom)
- 61.8% of budget leftAPIAPI latency under 500 ms99% target, 30-day window
- 88.4% of budget leftDashboardDashboard availability99.95% target, 30-day window
Access
One mode per page. The badge and widget follow it, so a private page never leaks through an embed.
- Public
- Anyone with the address. Badge, widget and JSON are open too.
- Every plan
- Password
- One shared password; a signed cookie keeps visitors in.
- Starter and up
- IP allowlist
- Only your office or VPN ranges. Every other address is refused.
- Starter and up
- JWT
- Signed in through your app, verified against your key or JWKS.
- Pro and up
- Customer scoped
- The token's subject is the customer, granted this page.
- Pro and up
Reliability
Reliability they can verify.
Uptime is counted from recorded readings, day by day. Publish your SLO targets with the budget left, and give customers a Reliability Center with monthly attainment.
Uptime
Only down days count against it.
A day with an unhealthy reading is down. Degraded days were served, so they count as up, and days without data are left out instead of counted as up.
Service levels
Targets in public, with the budget left.
Pro and upChoose which SLOs the page shows. Each row carries its target, its window and how much error budget remains.
Incidents
Incidents without the scramble.
When a metric breaks, Observer can draft the incident for you. Check it, publish it in one step, and the page and its subscribers hear about it together.
01Draft
Written from the breach.
Pro and upA metric that turns unhealthy can open a draft quoting the reading against its threshold. Drafts never reach the page until you publish.
02Publish
One step to go public.
The incident lands under the headline, subscribers are emailed and your alert channels are notified.
03Resolve
The all clear goes out too.
Every update and the resolution reach the same subscribers, so nobody has to check back.
Subscribers
Fewer tickets during an outage.
Customers who can see the status don't open a ticket to ask. They subscribe from the page, and your app and docs show it where they already are.
Subscribe, from the page
Subscribe to updates
Email when status changes. Confirmation required. Unsubscribe from any future email.
Confirmed by email. Each subscriber picks every change or a daily digest, and can leave from any message.
Status, in your docs
Webhooks
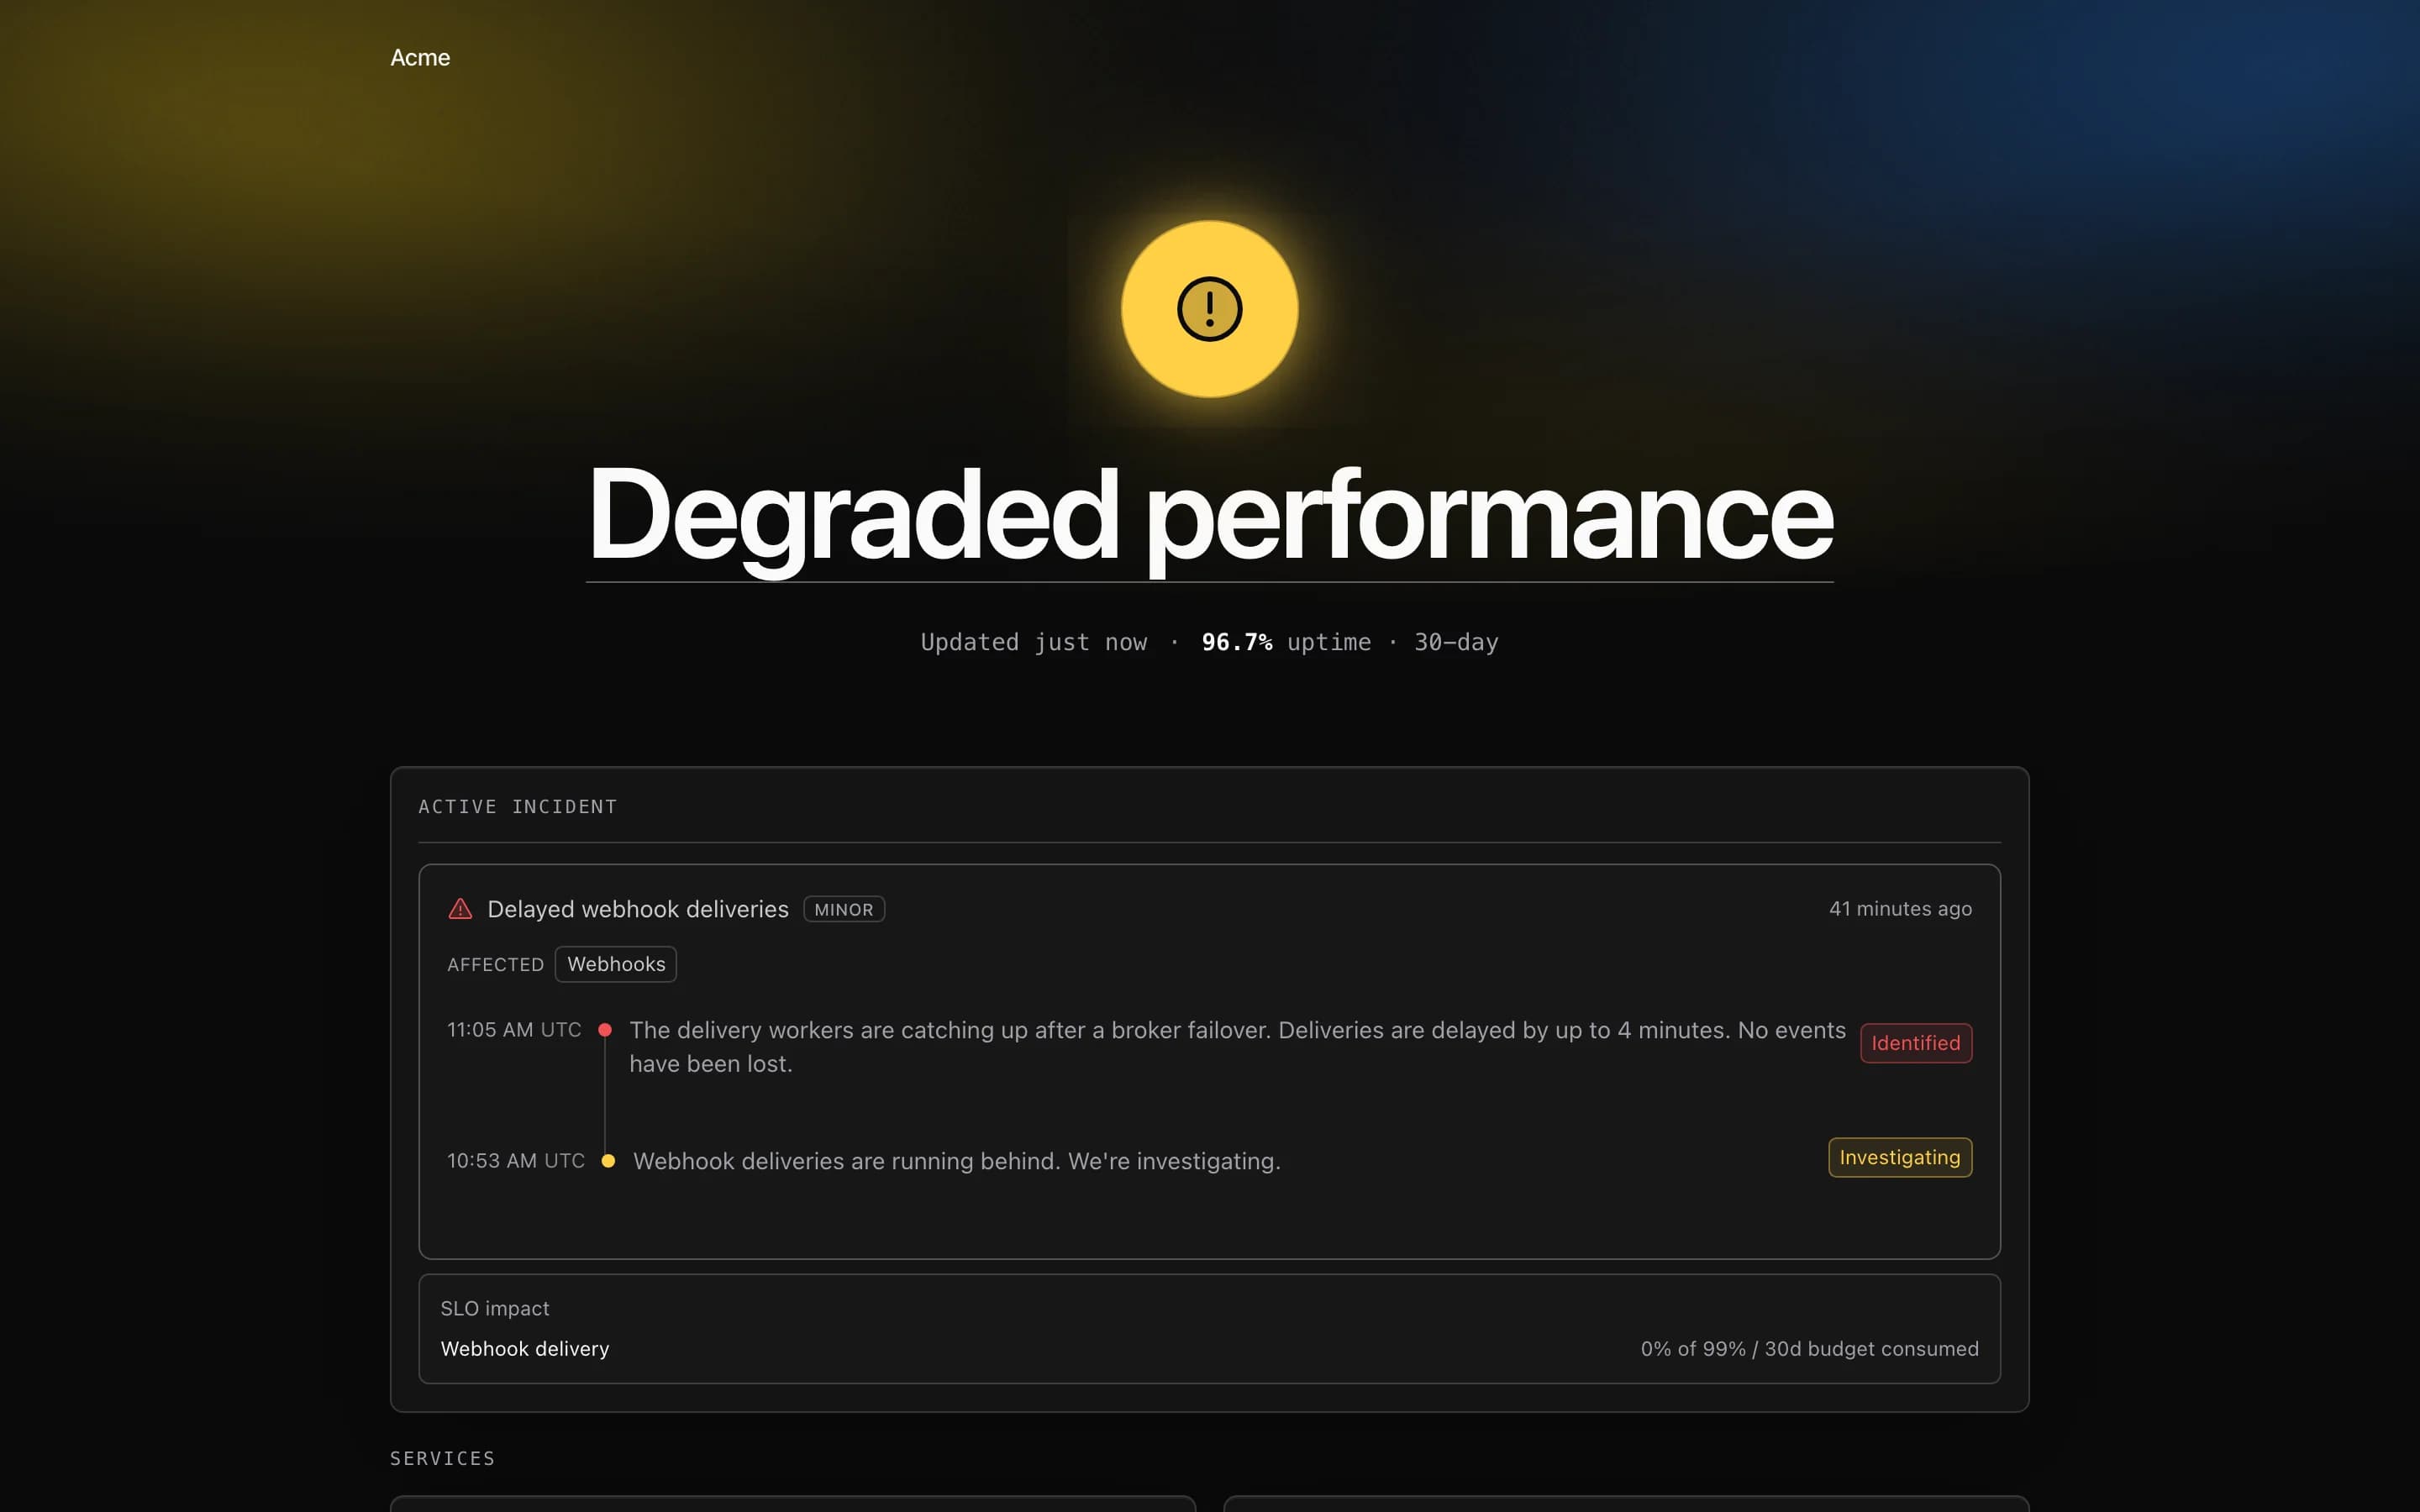
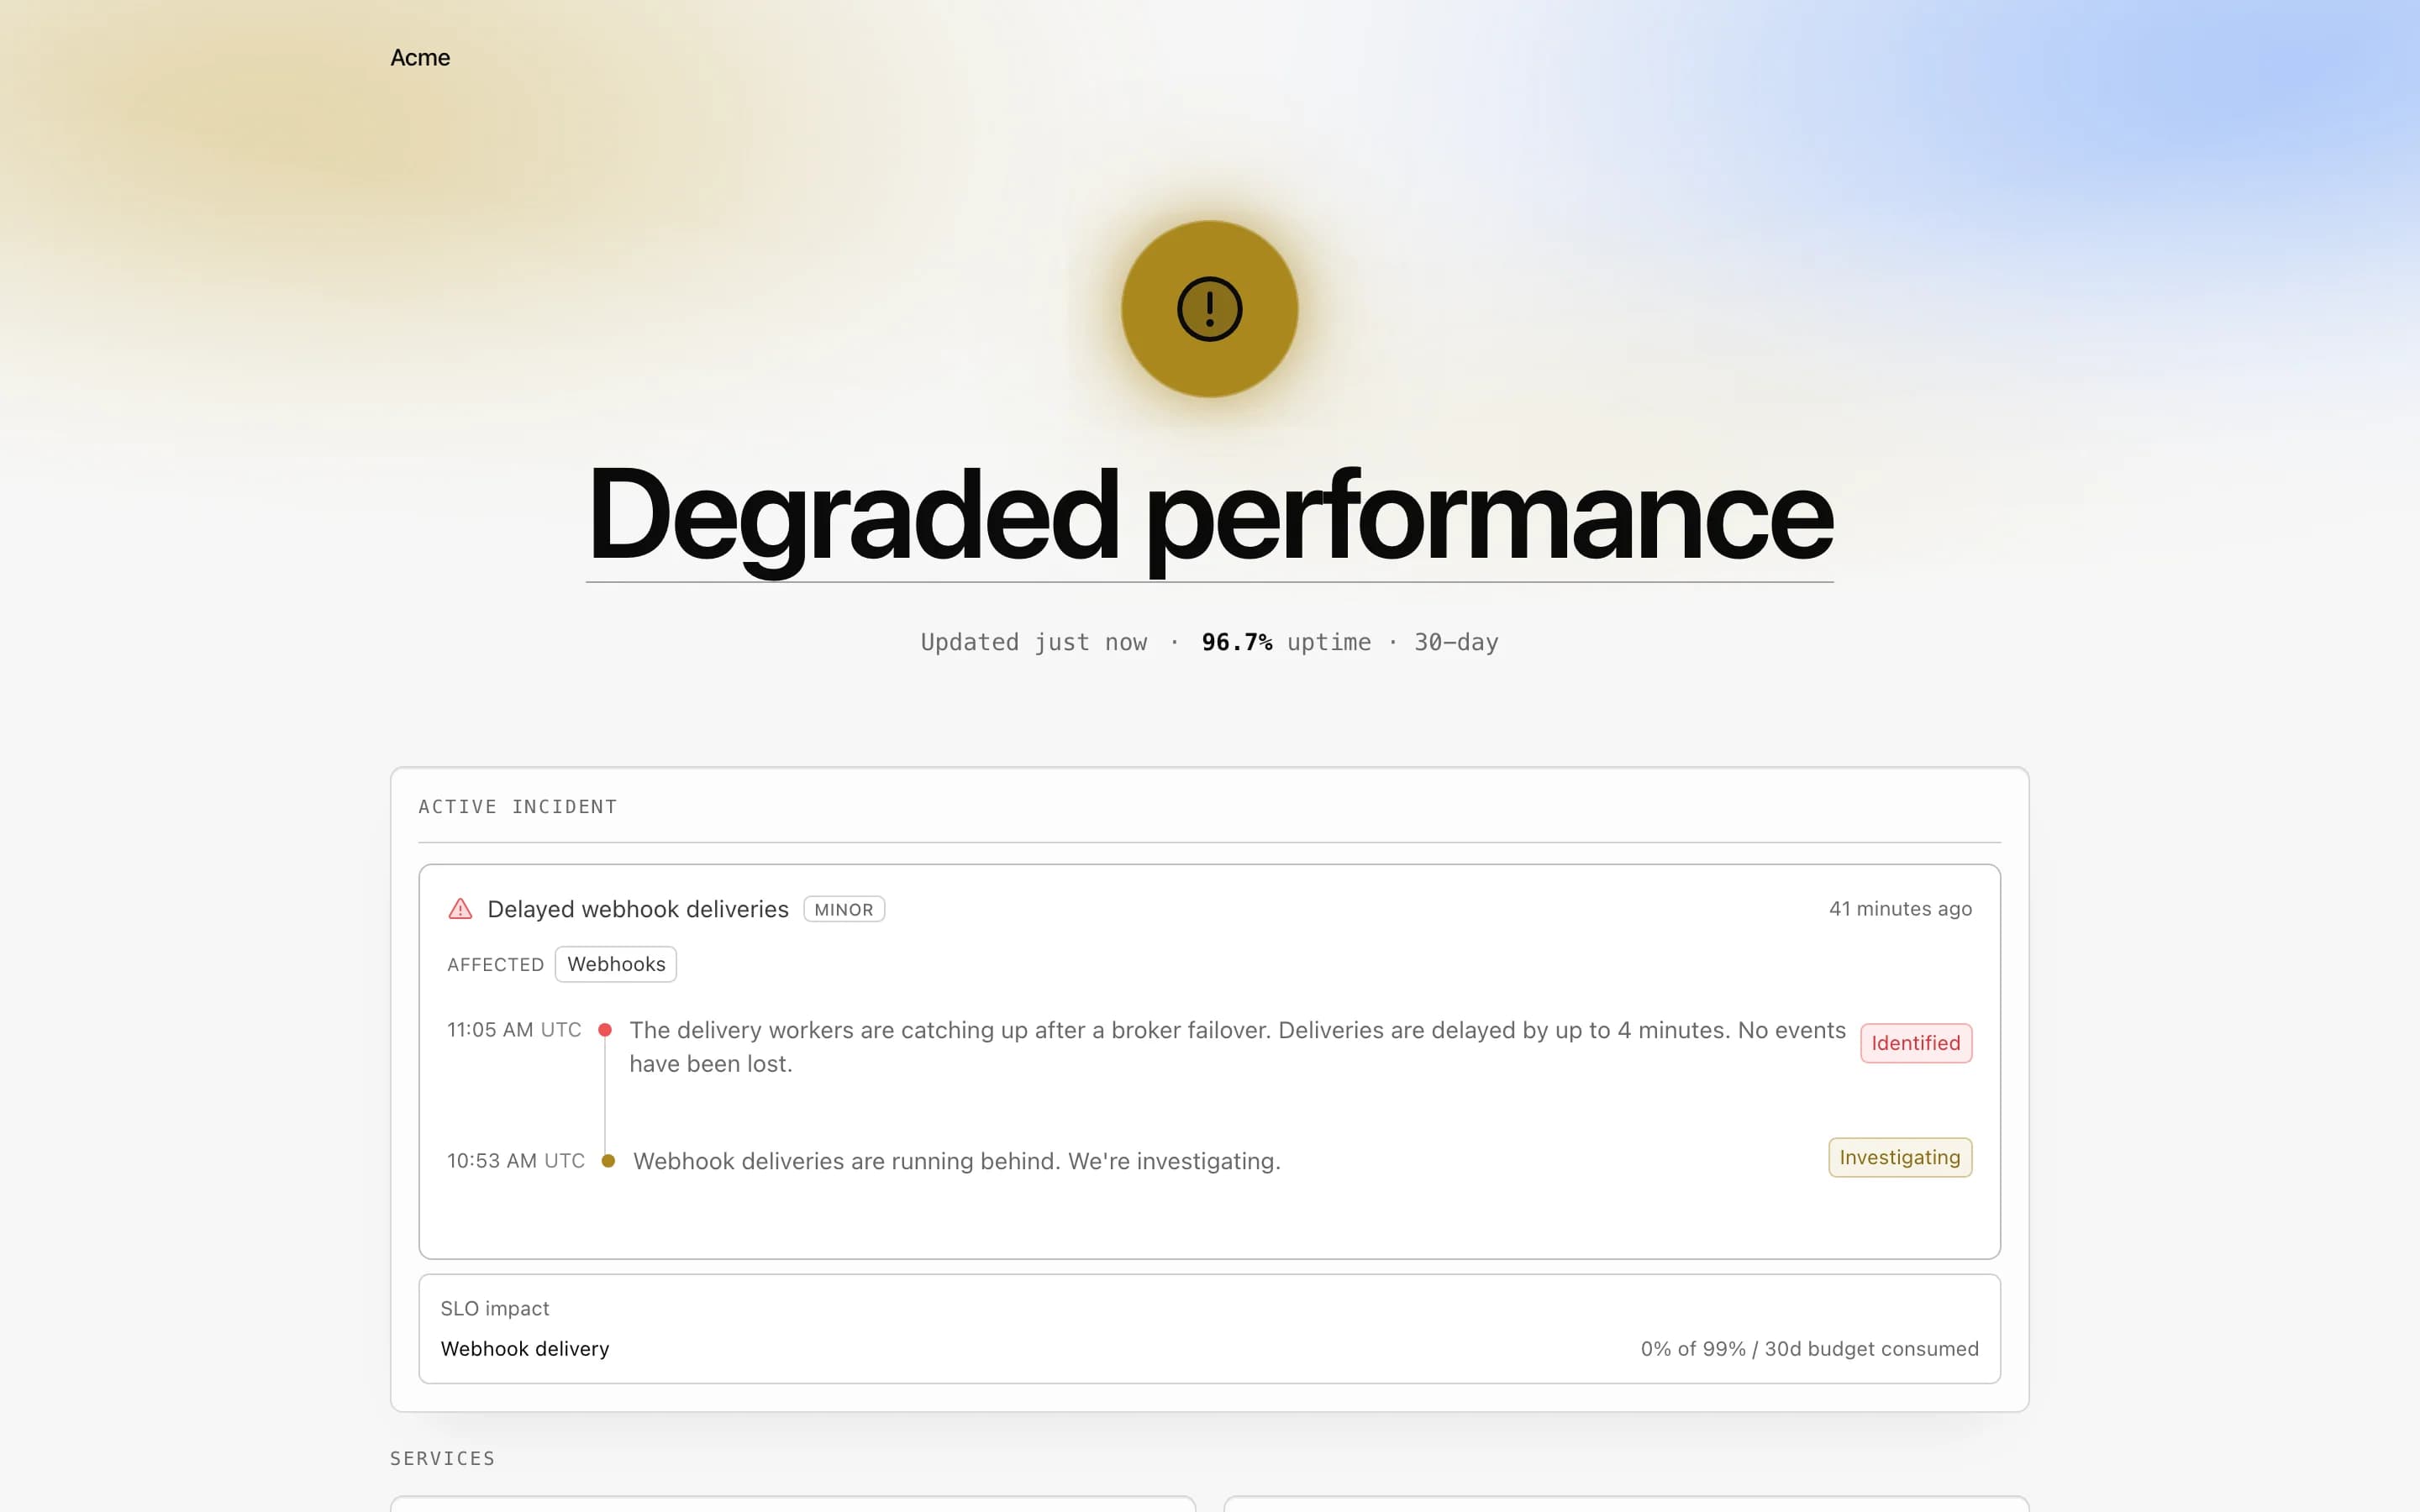
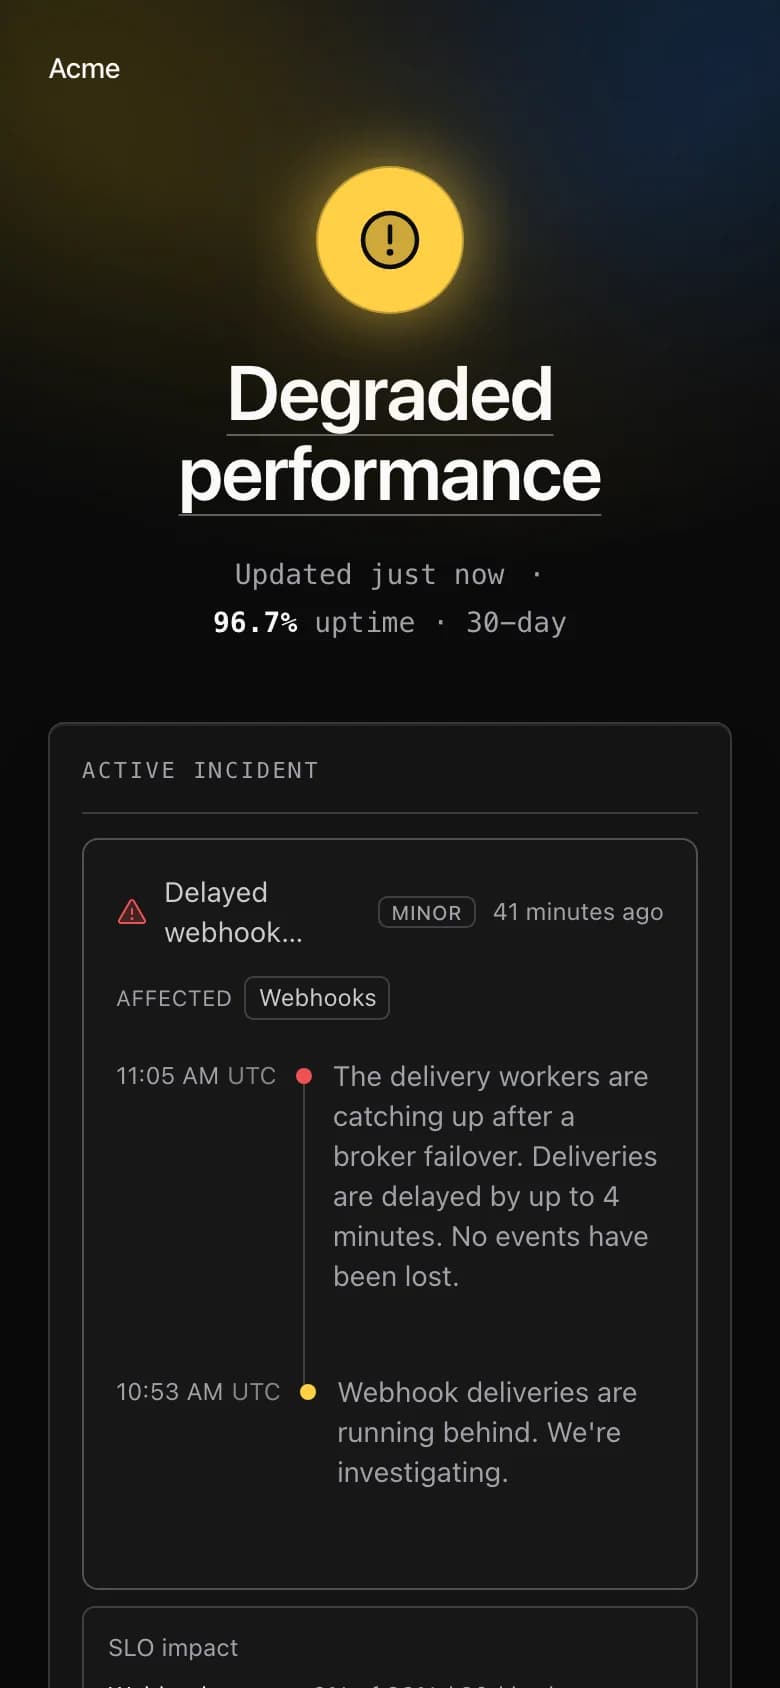
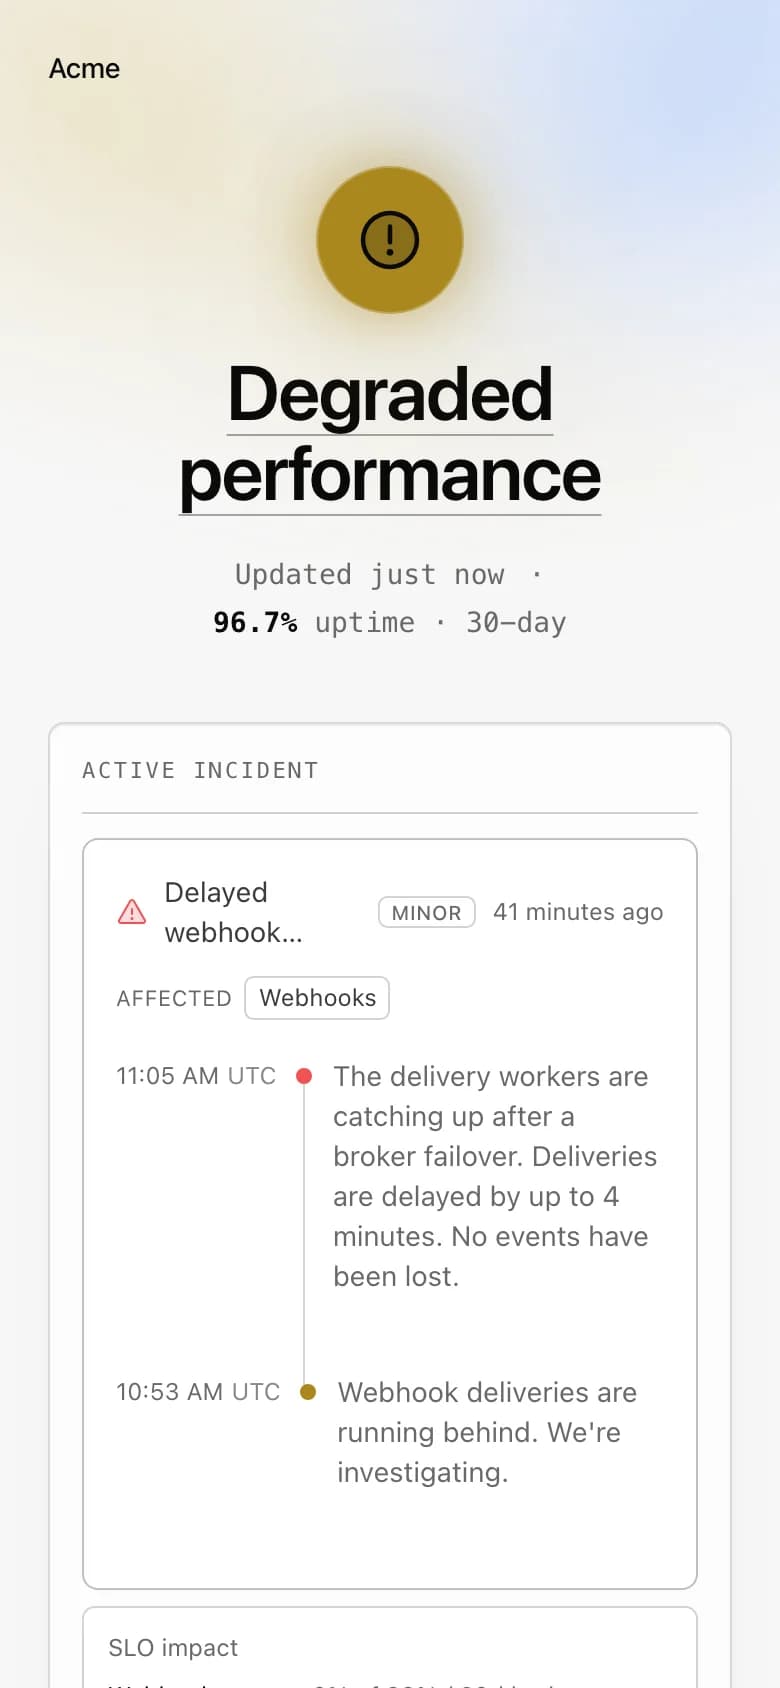
Degraded performance
Acme
- APIDegraded
- DashboardOperational
- WebhooksOperational
- DatabaseOperational
The badge and the widget are served from the page's own address and follow its access mode.
Every change, or one digest a day.
Free 5 · Pro 50,000Incidents scoped to a customer email only that customer's subscribers.
Feeds and JSON
Atom, RSS and a JSON document per page.
For readers, chat integrations and your own dashboards.
Widget and badge
Two snippets.
ReferenceThe badge can show 30-day uptime instead. Its color still follows the current status, so a degraded page never hides behind a green number.
<iframe src="https://status.example.com/embed" width="360" height="240" style="border:0"></iframe>
[](https://status.example.com)
Brand
Yours, on your domain.
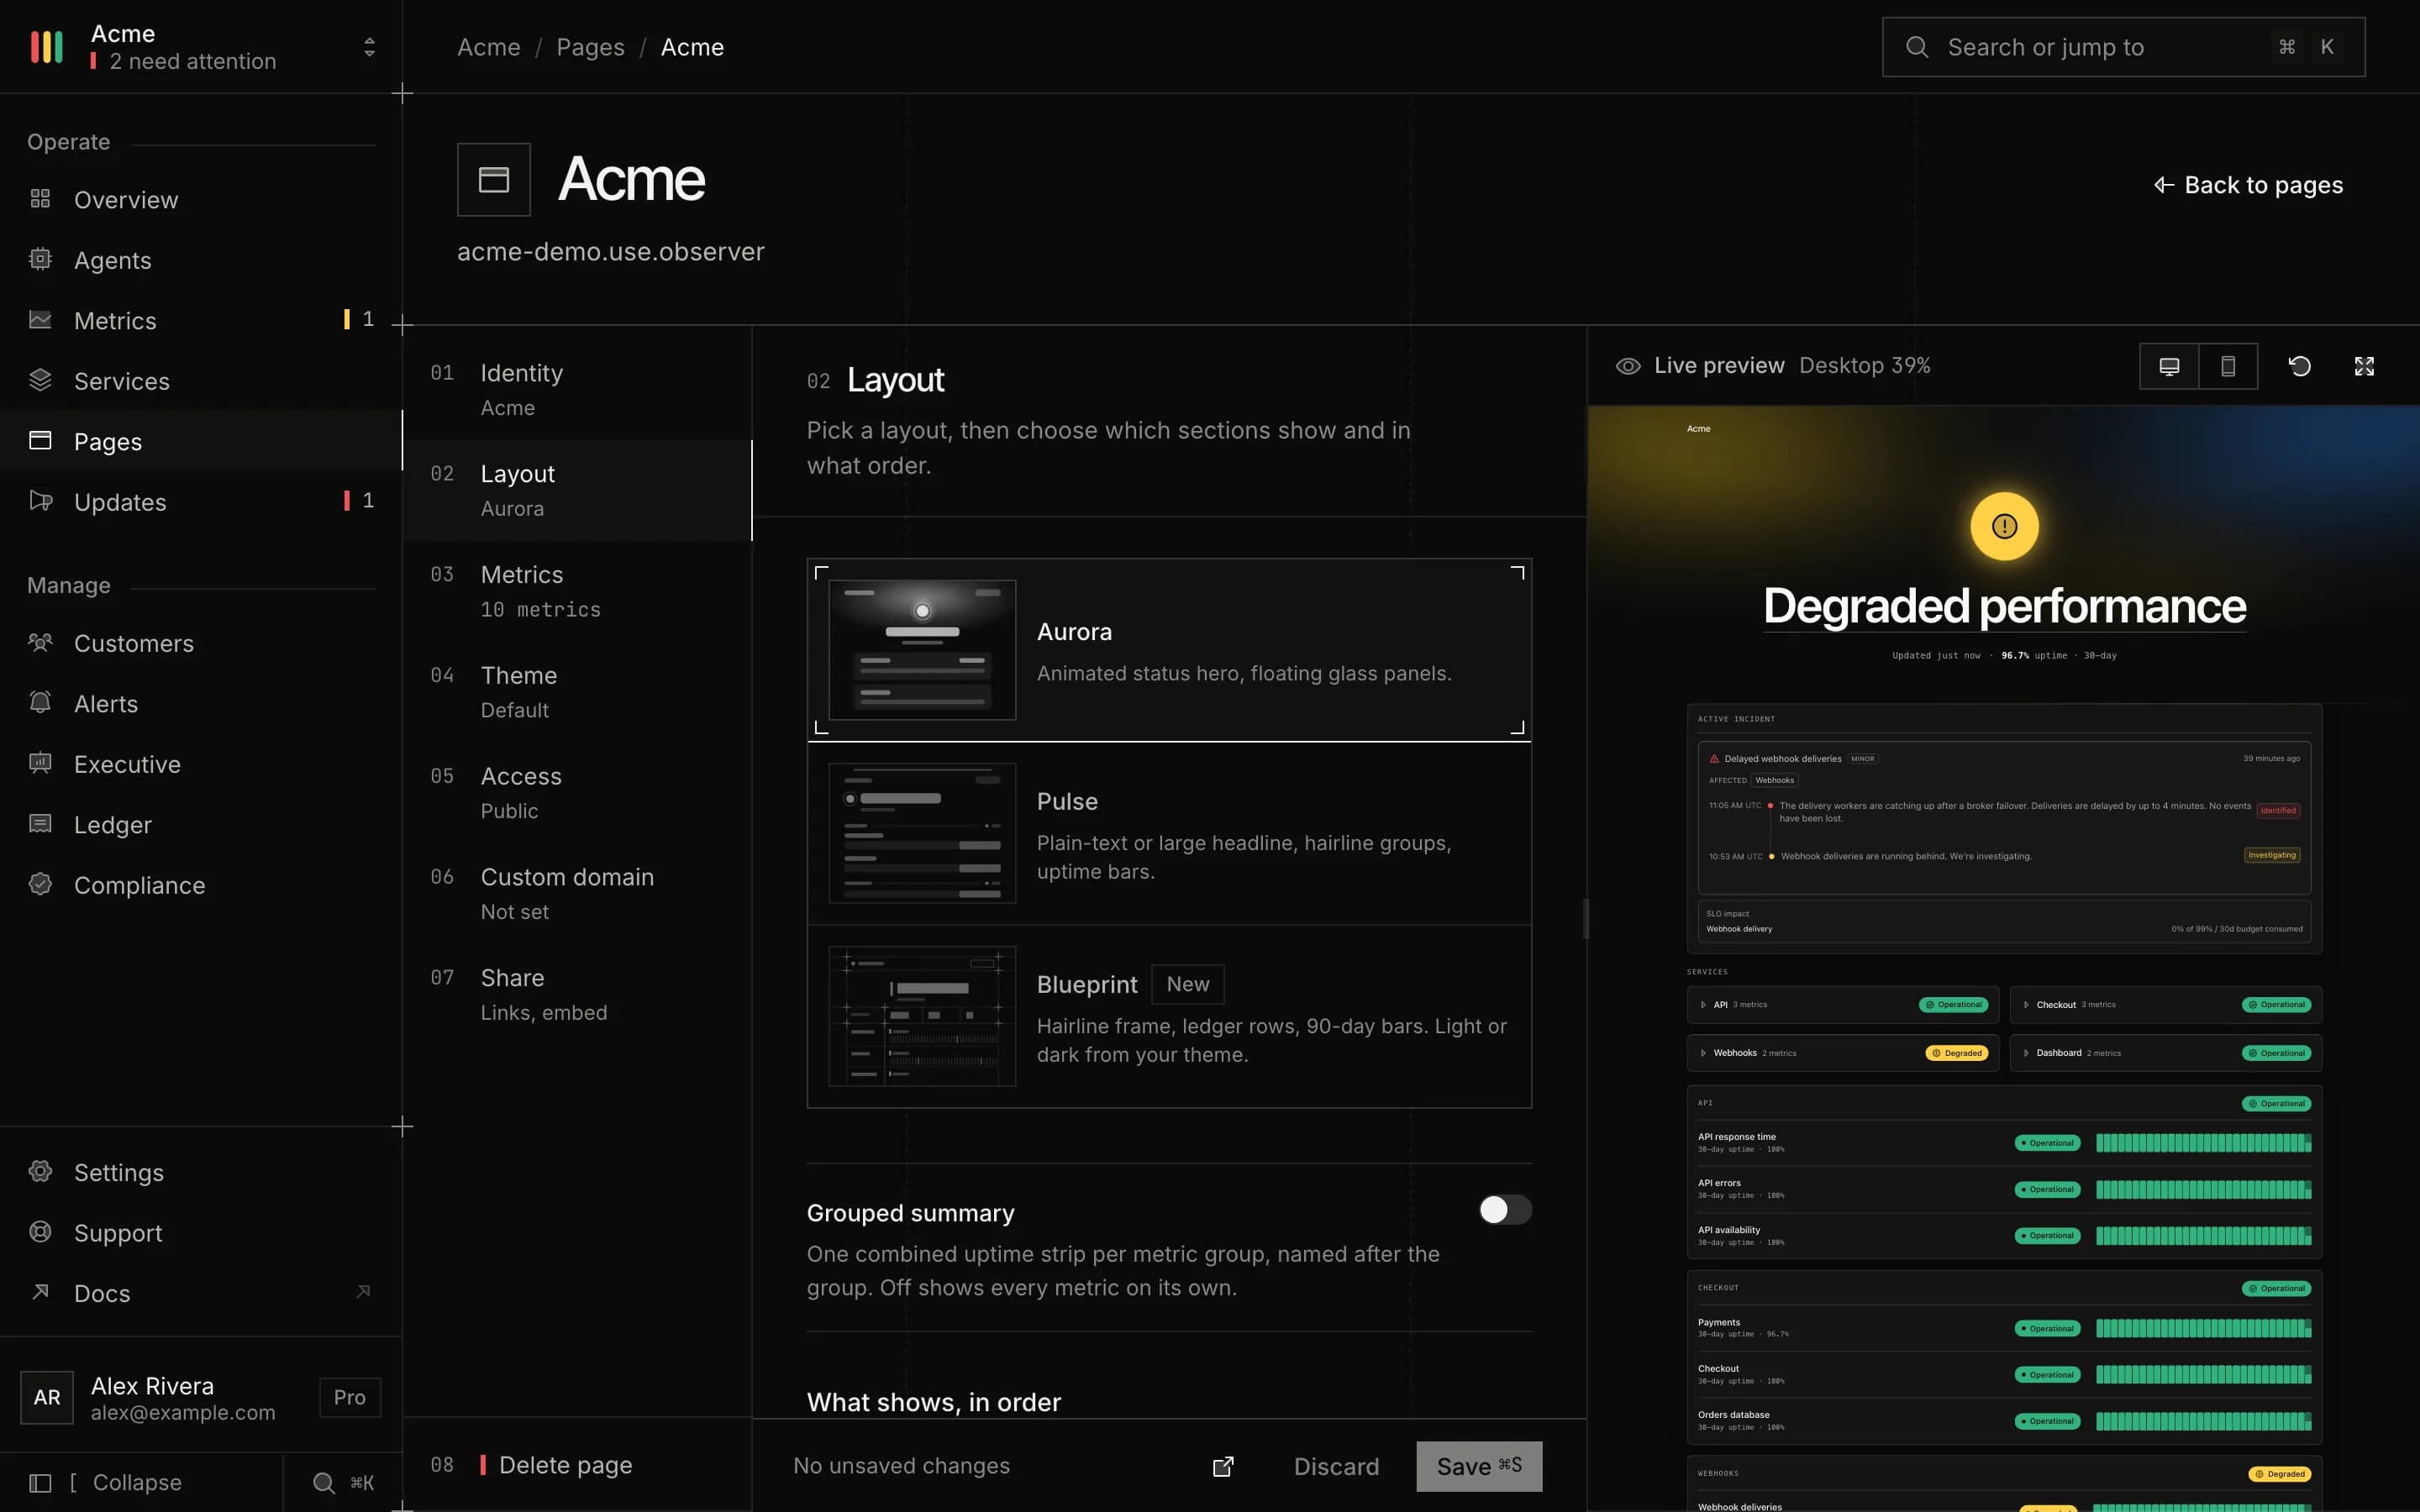
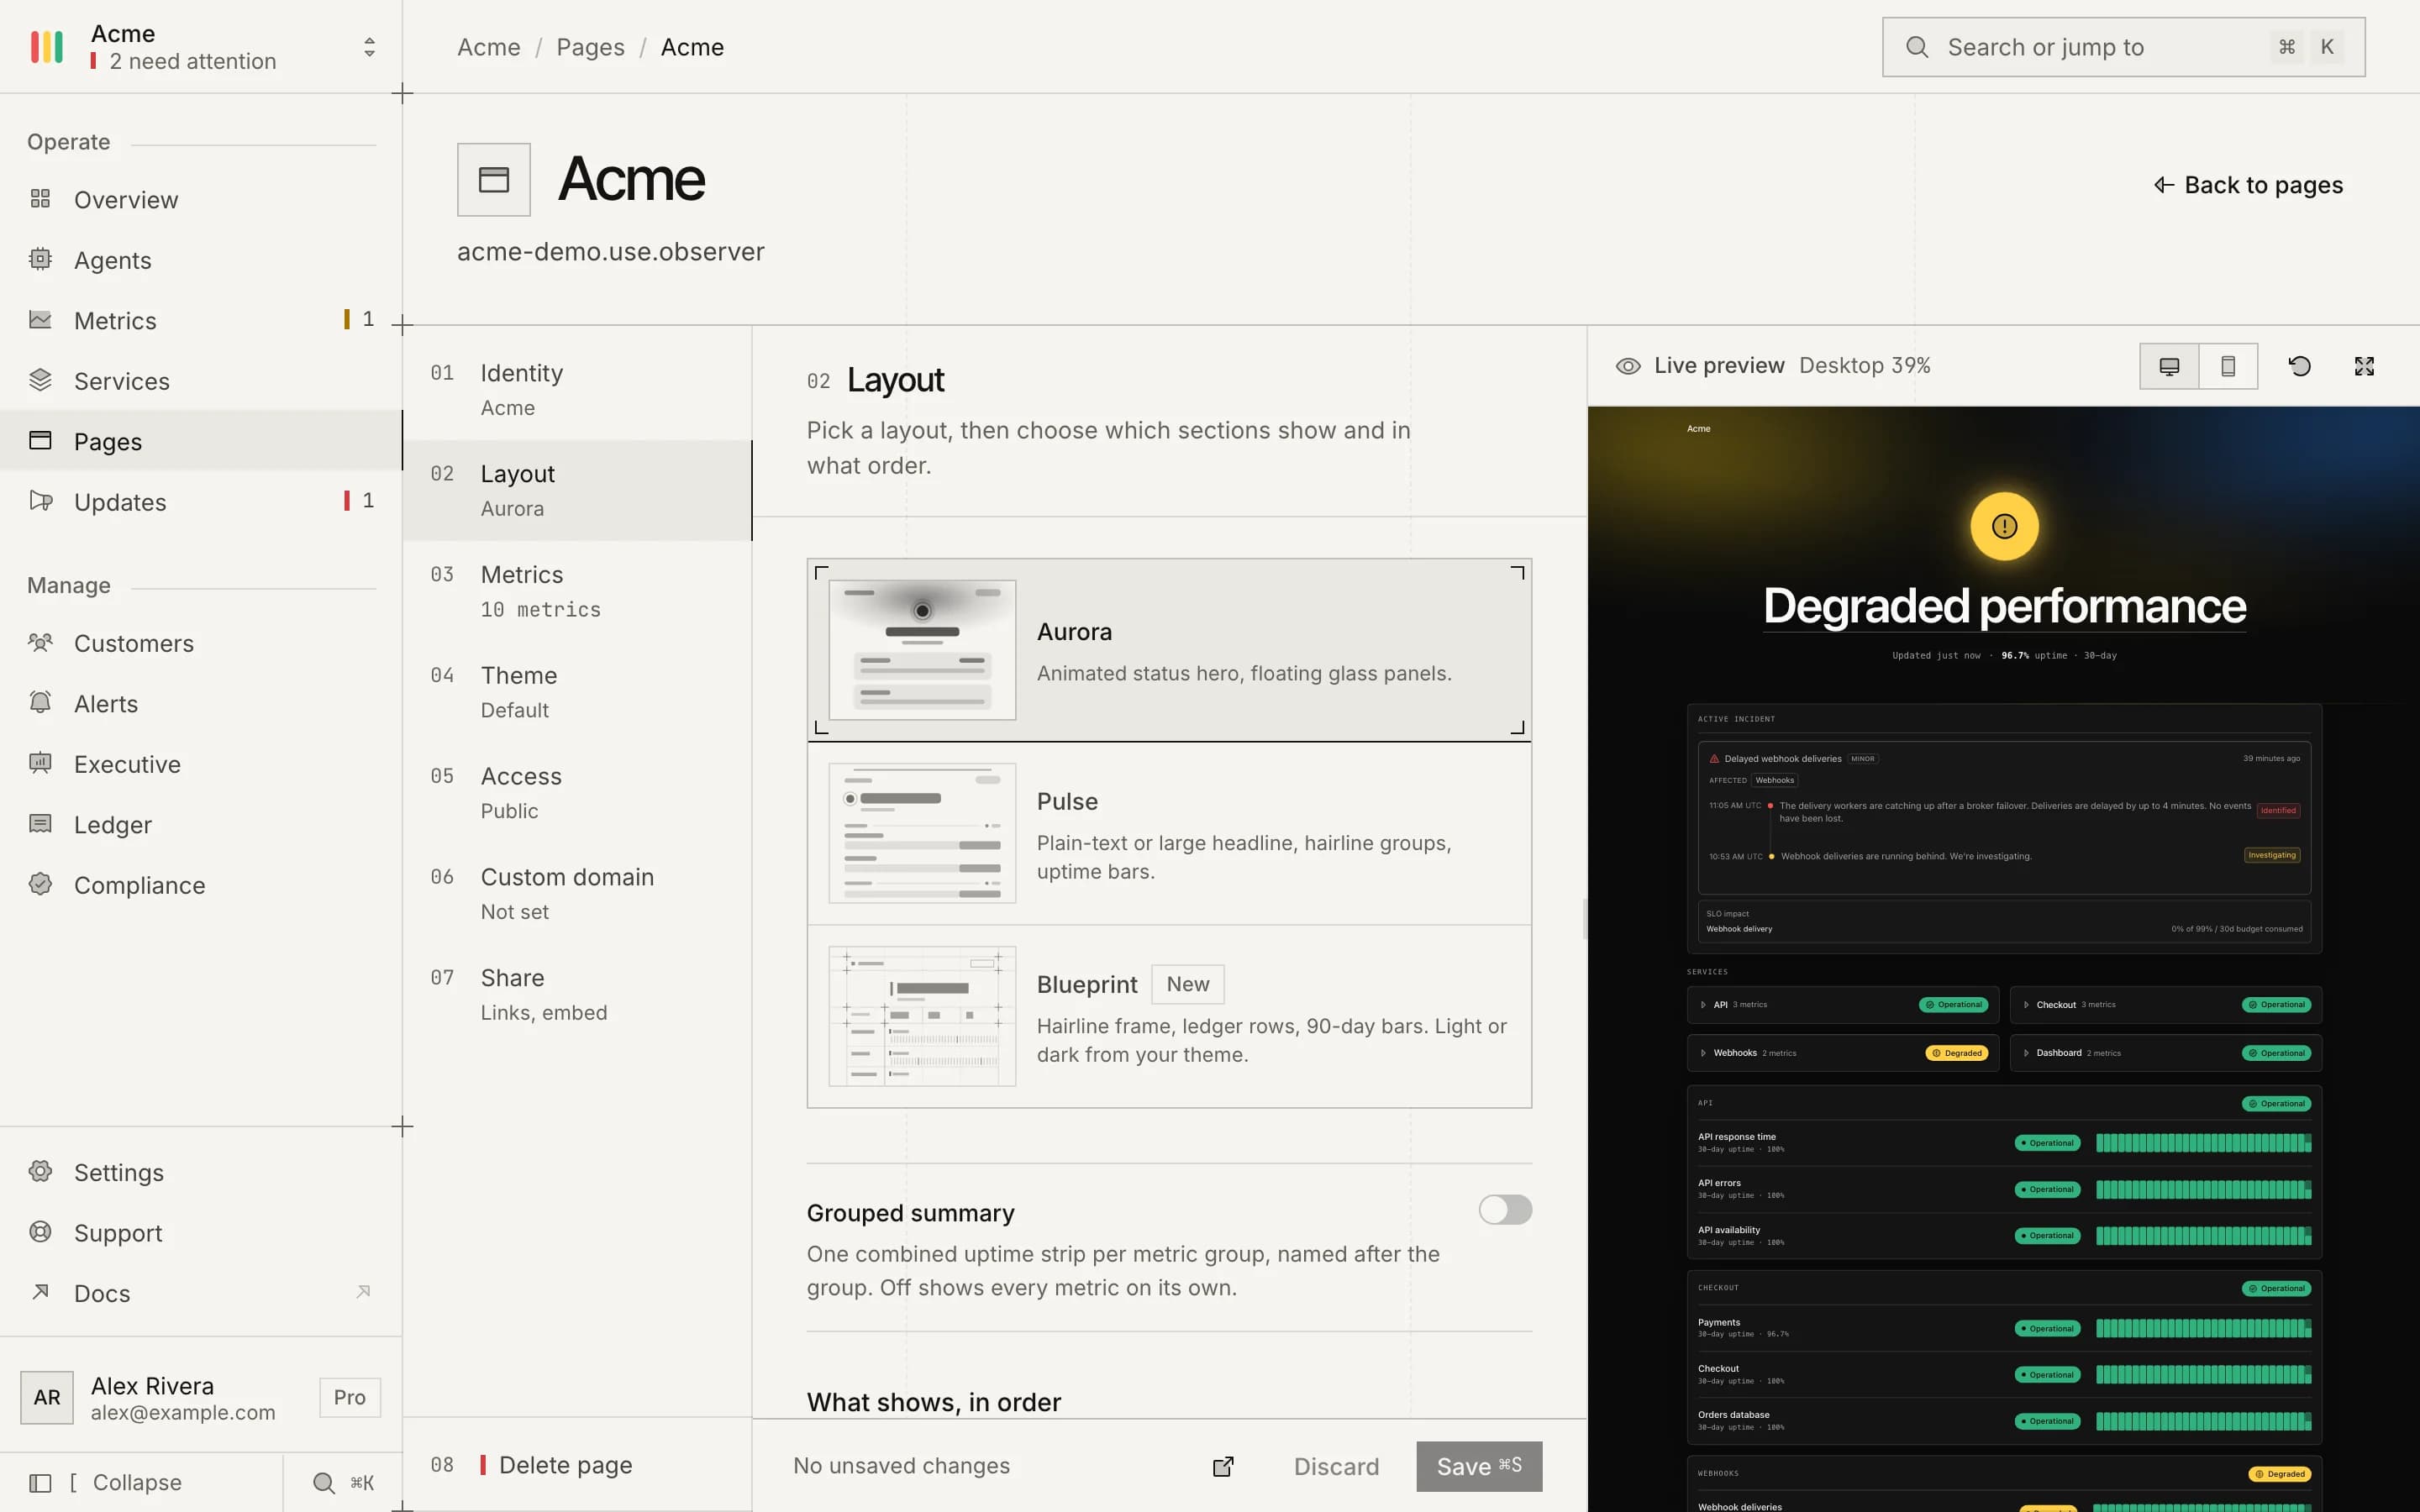
Three layouts, eight theme presets with editable tokens, custom CSS, and your own address with the certificate handled. Nothing reaches visitors until you save.
Minimal Dark
Minimal Light
Corporate Blue
Monochrome
Pastel
Serif Newspaper
Terminal Green
Vibrant Card

The page builder: pick a layout and sections, preview against your real metrics at desktop and phone width.
The one record
- Type
- CNAME
- Name
- status
- Value
- cname.use.observer
What the console shows
- Waiting for DNS
- DNS verified
- Issuing certificate
- Live
Domains per plan
- Starter
- 1
- Pro
- 5
- Business
- 10
- Enterprise
- Unlimited
Theme
A color that would fail WCAG AA is lifted until it passes, keeping its hue. Blueprint keeps its own ink palette and takes your logo and accent.
Proof
See ours. Then set up yours.
status.use.observer is an Observer page, reading Observer's own metrics. Yours can be public in about ten minutes.


01Agent
Run the agent.
2 minOne container next to your data. It only dials out; nothing connects in.
02Metric
Define what working means.
5 minA query and two thresholds per metric, compared with strict operators.
03Page
Put it on a page.
Pick the metrics, a layout and a theme, then publish. The page follows the signal from then on.